
In Four DisCos, Government Paid About as Much for Your Light as You Did

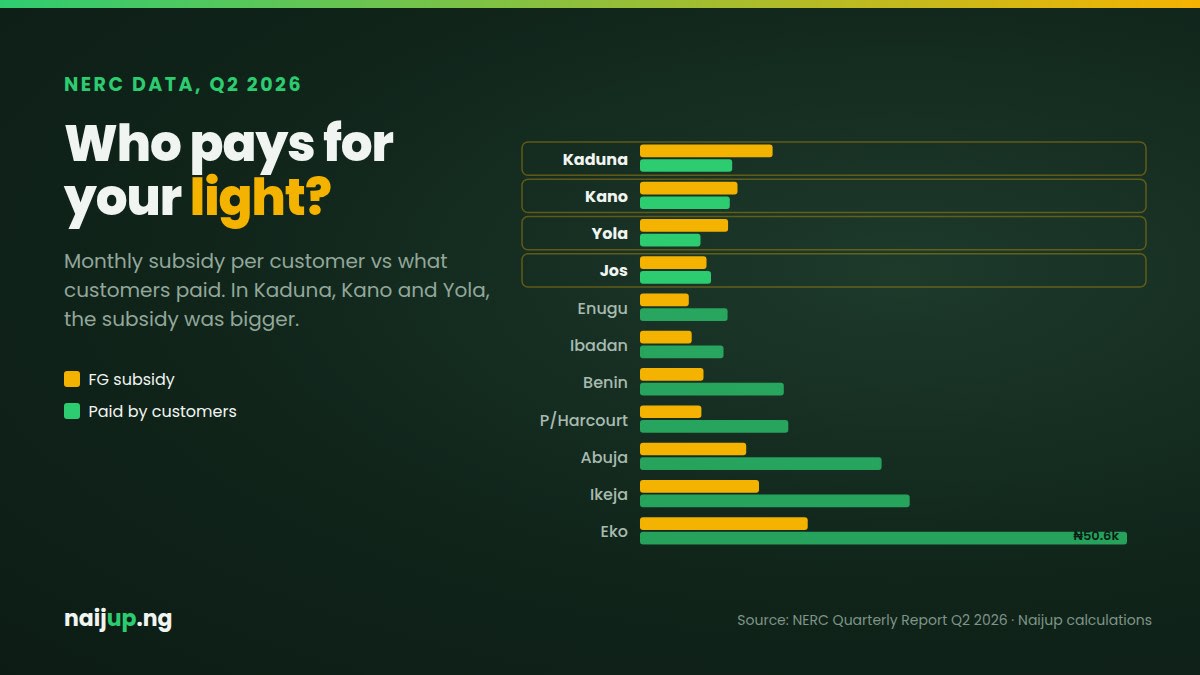
Everybody talks about the electricity subsidy like it's one big number in Abuja. ₦321 billion here, "FG owes GenCos" there. But the subsidy isn't spread evenly. Depending on which DisCo supplies your house, government may be carrying a small part of your bill, or most of it.
We went through NERC's own Q2 2026 quarterly report (April to June) and broke the subsidy down DisCo by DisCo. Then we compared it to what customers in each area actually paid. The result surprised us a bit.
First, how the subsidy works (quick version)
GenCos sell power to DisCos. The full cost of that power in Q2 2026 was ₦647.72 billion. But DisCos are only asked to pay part of it, the part their approved tariffs can cover. NERC calls this the DRO-adjusted invoice.
The gap between the full cost and what DisCos are asked to pay is the subsidy. Federal government owes it. In Q2 2026 it was ₦321.26 billion, about 49.6% of the full generation bill. In Q1 it was ₦358.32 billion (51.95%).
So nationally, government is covering roughly half the cost of the power that gets to DisCos. That's the average. Now the interesting part.
The subsidy share, DisCo by DisCo
We took each DisCo's full GenCo invoice and subtracted what it was actually invoiced to pay:
| DisCo | Full generation cost (₦bn) | DisCo invoiced (₦bn) | Subsidy (₦bn) | Share subsidised |
|---|---|---|---|---|
| Yola | 16.96 | 2.85 | 14.11 | 83.2% |
| Kano | 39.97 | 15.46 | 24.51 | 61.3% |
| Kaduna | 39.64 | 16.66 | 22.98 | 58.0% |
| Jos | 32.42 | 15.22 | 17.20 | 53.1% |
| Ibadan | 79.79 | 38.84 | 40.95 | 51.3% |
| Enugu | 52.52 | 26.99 | 25.53 | 48.6% |
| Ikeja | 104.59 | 54.57 | 50.02 | 47.8% |
| Eko | 75.39 | 39.53 | 35.86 | 47.6% |
| Port Harcourt | 44.73 | 23.78 | 20.95 | 46.8% |
| Abuja | 106.67 | 60.16 | 46.51 | 43.6% |
| Benin | 55.03 | 32.40 | 22.63 | 41.1% |
Yola is the outlier. For every ₦100 of power that went to Yola DisCo in Q2, the DisCo was only asked to pay about ₦17. The rest sits on government's tab.
Per customer, per month: subsidy vs what you paid
Big naira totals don't mean much on their own, so we divided by the number of active customers in each DisCo (as at 30 June 2026), then by 3 to get a monthly figure. We did the same with the cash each DisCo actually collected from customers.
| DisCo | Subsidy per customer / month | Paid by customer / month (avg) |
|---|---|---|
| Kaduna | ₦13,792 | ₦9,591 |
| Kano | ₦10,136 | ₦9,334 |
| Yola | ₦9,158 | ₦6,289 |
| Jos | ₦6,918 | ₦7,389 |
| Eko | ₦17,442 | ₦50,644 |
| Ikeja | ₦12,376 | ₦28,050 |
| Abuja | ₦11,045 | ₦25,125 |
| Benin | ₦6,601 | ₦14,956 |
| Port Harcourt | ₦6,383 | ₦15,426 |
| Enugu | ₦5,077 | ₦9,108 |
| Ibadan | ₦5,381 | ₦8,679 |
Look at the top three. In Kaduna, Kano and Yola, government's subsidy per customer was more than the average customer actually paid. In Jos, it was close: ₦6,918 against ₦7,389.
In Lagos it's a totally different picture. An average Eko customer paid about ₦50,600 a month, nearly 3 times the subsidy attached to them. Ikeja and Abuja customers paid more than double their subsidy too.
Why this happens
A few things combine here, and it isn't just "the North gets more":
1. Collections are weak. Kaduna collected only 52.16% of what it billed in Q2. Kano collected 47.74%, the lowest of all 11. Jos was 55.02%. When the customer side pays less, the subsidy looks bigger next to it.
2. Lots of customers have no meter. Jos (64.6% unmetered), Yola (63.8%), Kaduna (60.2%) and Kano (59.3%) have the lowest metering rates in the country. Unmetered customers are billed on estimates, and estimated bills are the ones people fight and refuse to pay.
3. Fewer Band A customers. The big subsidy cut in 2024 hit Band A (20 hours+ supply) feeders hardest. Lagos and Abuja have more of those, so more of their power is sold at closer to cost-reflective prices. That's our reading of the pattern, not a figure from the NERC report itself.
The thing nobody says out loud
The ₦321 billion subsidy in Q2 is equal to 53% of all the cash DisCos collected from customers in that quarter (₦603.64 billion). So for every ₦2 Nigerians paid their DisCos, government owed roughly another ₦1 on top, and it isn't fully paying that either. The unpaid subsidy keeps building up as debt to GenCos.
And the remittance numbers for the high-subsidy DisCos are poor too. Kaduna paid only 51.91% of its market invoice in Q2, Jos 63.38%, Kano 67.28%. So in those areas government covers most of the power cost, customers pay about half their bills, and the DisCo still doesn't fully pay for the small portion left. That's three layers of shortfall stacked on each other.
What this means for you
• If you're in Lagos, Abuja or Ibadan, don't expect your tariff to fall. The subsidy share in your area is already below the national average, and any further tariff review will likely start from Band A again.
• If you're in the Kano, Kaduna, Jos or Yola networks, your area is the most exposed if government ever cuts the subsidy further. Two-thirds of the cost of your power could suddenly shift to the tariff.
• Push for a meter. Every report shows the same thing: estimated billing is where trust breaks down. A prepaid meter means you only pay for what you use, no argument.
We'll update this when NERC releases the Q3 2026 numbers. If your DisCo is charging you estimated bills even after you applied for a meter, tell us in the comments. We'd like to know how common that still is.
Quick FAQ
How much electricity subsidy did Nigeria pay in Q2 2026?
NERC's Q2 2026 report puts the federal government's tariff subsidy obligation at ₦321.26 billion, about 49.6% of the ₦647.72 billion generation cost.
Which DisCo gets the highest electricity subsidy?
By share, Yola: 83.2% of its generation cost in Q2 2026 was subsidised. By naira amount, Ikeja (₦50.02bn) and Abuja (₦46.51bn) got the most, because they take the most power.
Why is the subsidy higher than what customers pay in Kano and Kaduna?
Low collection rates (under 53% of bills), many unmetered customers on estimated bills and a large subsidised share of generation costs all combine in these areas.
Data source: NERC Quarterly Report, Q2 2026 (Tables 5, 7, 9, 10 and 15) and Q1 2026. Per-customer figures are Naijup calculations: subsidy or collections ÷ active customers ÷ 3 months. They're averages across all customer types, including businesses, so your household bill may be quite different.
Found this useful? Share it
Help friends, family and colleagues stay informed on Nigerian finance.
Keep reading
Related Topics
Conversation
Comments (0)
Sign in to join the conversation or like this post.
Mujeeb Olagunju
I am a finance professional with a strong background in economics and financial technology.,My work centers on building systems that support payments, digital banking, and investment solutions in emerging markets.,I have experience with risk management, transaction monitoring, fraud prevention, and the design of scalable financial products tailored to both retail and institutional clients.,With over 8 years of industry experience, I combine financial insight with technical expertise to deliver solutions that balance compliance, security, and business growth.,My goal is to bridge the gap between finance and technology, creating platforms that expand access to modern financial services and strengthen trust in digital finance.
94
Stories
30477
Reads
0
Likes
0
Comments