
Imo's Inflation Is 28.66%. Taraba's Is 6.12%. Where Does Your State Rank?

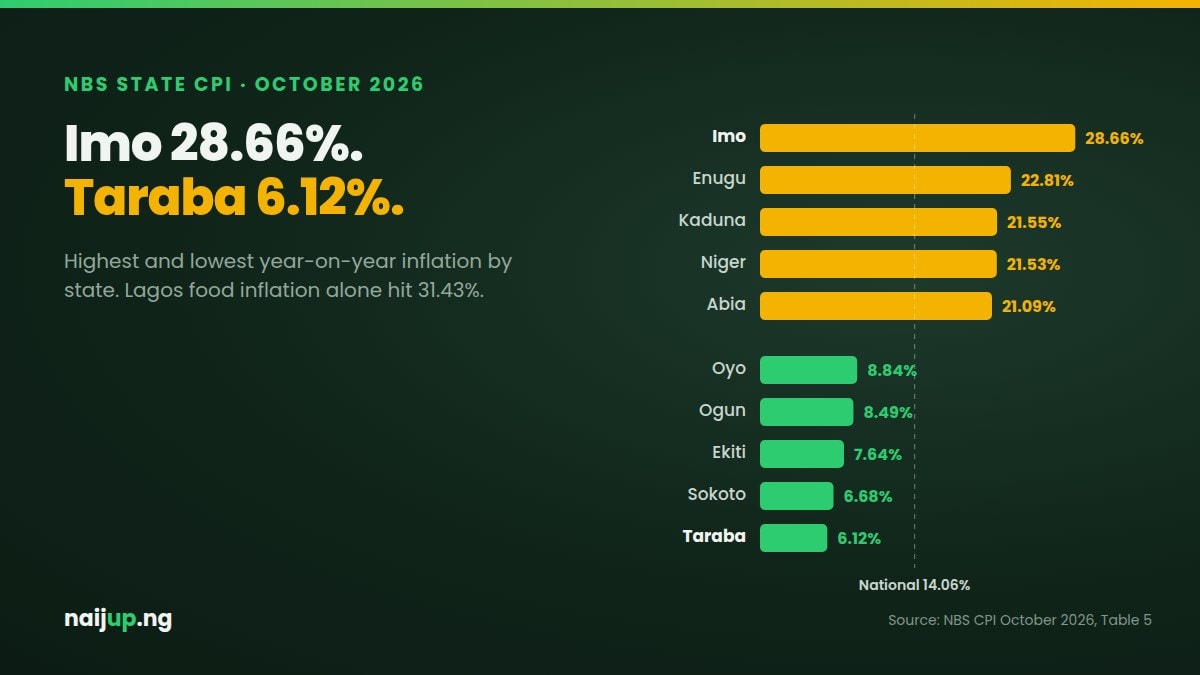
Nigeria's national inflation rate for October 2026 is 14.06%. But nobody lives in "Nigeria on average". You live in a state, and the gap between states is massive.
In Imo, prices were 28.66% higher than a year earlier. In Taraba, just 6.12%. Same country, same month, nearly five times the difference.
Highest and lowest
| Highest inflation | Oct 2026 | Lowest inflation | Oct 2026 | |
|---|---|---|---|---|
| Imo | 28.66% | Taraba | 6.12% | |
| Enugu | 22.81% | Sokoto | 6.68% | |
| Kaduna | 21.55% | Ekiti | 7.64% | |
| Niger | 21.53% | Ogun | 8.49% | |
| Abia | 21.09% | Oyo | 8.84% |
Three of the top five are South-East states: Imo, Enugu and Abia. The other two, Ebonyi (20.55%) and Anambra (19.77%), are just behind. All five South-East states are above the national average.
Imo stands out. At 28.66%, it's almost 6 points clear of Enugu in second place.
Low headline, high food bill: the South-West puzzle
Here's what jumped out when we lined up headline and food inflation for each state. Several South-West states have some of the lowest overall inflation, but some of the highest food inflation:
| State | All items | Food |
|---|---|---|
| Ondo | 10.31% | 31.74% |
| Lagos | 15.54% | 31.43% |
| Oyo | 8.84% | 28.81% |
| Ogun | 8.49% | 22.47% |
| Ekiti | 7.64% | 20.61% |
Ondo and Lagos have the two highest food inflation rates in the country. Oyo is fourth. Meanwhile their headline numbers look calm.
How does that happen? Other parts of their baskets, like services, transport or clothing, rose slowly or even fell. Oyo's overall index actually dropped 6.71% in October alone. So the average gets pulled down while food stays high.
If you live in Lagos or Ondo and spend most of your money on food, the 10–15% headline doesn't describe your life. 31% does.
The opposite in parts of the North
Some northern states have the reverse pattern: food inflation below their headline rate.
• Nasarawa: food 3.70%, all items 11.85%
• Kano: food 7.13%, all items 11.66%
• Bauchi: food 8.19%, all items 12.64%
• Taraba: food 8.93%, all items 6.12%
Nasarawa's 3.70% is the lowest food inflation in Nigeria. Being close to big farming areas seems to help.
But October was a rough month for the North-East
On a month-on-month basis (October vs September), the picture flips. The biggest jumps were all in the North:
| State | All items, MoM | Food, MoM |
|---|---|---|
| Bauchi | +11.23% | +9.66% |
| Borno | +10.94% | +13.96% |
| Yobe | +9.93% | +18.41% |
| Ebonyi | +8.86% | +2.38% |
| Adamawa | +7.62% | +3.07% |
Food prices in Yobe went up 18.41% in one month. Kebbi (+16.45%), Sokoto (+12.99%), Jigawa (+12.91%) and Taraba (+11.97%) also saw double-digit monthly food jumps.
That's unusual for October, when harvest normally pushes food prices down. The NBS doesn't explain it state by state. Security problems around farms and roads in the North-East are one likely reason, but we can't confirm that from this data alone.
Meanwhile the biggest monthly falls were in the South: Oyo (−6.71%), Osun (−4.78%), Akwa Ibom (−4.41%) and Delta (−4.33%).
Full table: all 36 states and FCT
| State | All items YoY | Food YoY | All items MoM |
|---|---|---|---|
| Imo | 28.66% | 29.75% | 1.76% |
| Enugu | 22.81% | 23.48% | 5.12% |
| Kaduna | 21.55% | 20.32% | 4.03% |
| Niger | 21.53% | 15.78% | 4.45% |
| Abia | 21.09% | 24.22% | 6.01% |
| Ebonyi | 20.55% | 27.96% | 8.86% |
| Anambra | 19.77% | 22.23% | 6.23% |
| Zamfara | 17.36% | 22.88% | 6.30% |
| Benue | 16.71% | 15.20% | 1.55% |
| Yobe | 16.53% | 22.26% | 9.93% |
| FCT Abuja | 16.42% | 15.70% | 3.83% |
| Kwara | 16.32% | 13.65% | 0.95% |
| Plateau | 15.70% | 16.56% | 1.54% |
| Lagos | 15.54% | 31.43% | −1.75% |
| Bayelsa | 15.31% | 7.11% | −2.18% |
| Adamawa | 15.13% | 16.44% | 7.62% |
| Borno | 14.83% | 16.68% | 10.94% |
| Gombe | 13.98% | 18.74% | 3.66% |
| Kogi | 13.42% | 13.81% | 4.68% |
| Rivers | 13.03% | 25.33% | −2.48% |
| Delta | 12.73% | 23.91% | −4.33% |
| Bauchi | 12.64% | 8.19% | 11.23% |
| Akwa Ibom | 12.51% | 21.56% | −4.41% |
| Kebbi | 12.29% | 22.21% | 6.03% |
| Nasarawa | 11.85% | 3.70% | 3.73% |
| Kano | 11.66% | 7.13% | 1.81% |
| Edo | 11.48% | 21.52% | −2.43% |
| Cross River | 11.25% | 16.29% | −2.30% |
| Ondo | 10.31% | 31.74% | −3.13% |
| Jigawa | 10.26% | 19.47% | 4.88% |
| Katsina | 9.30% | 19.93% | −2.19% |
| Osun | 9.25% | 18.00% | −4.78% |
| Oyo | 8.84% | 28.81% | −6.71% |
| Ogun | 8.49% | 22.47% | −2.45% |
| Ekiti | 7.64% | 20.61% | −1.09% |
| Sokoto | 6.68% | 21.40% | 1.40% |
| Taraba | 6.12% | 8.93% | 5.68% |
A fair warning from the NBS itself: each state's CPI uses weights based on what people in that state spend money on, so comparing baskets between states isn't perfect. Use the table as a guide to direction, not a precise league table.
What this means for you
• Moving or relocating staff? Cost-of-living differences between states are real and growing. Lagos food inflation at 31% vs Kano at 7% is a big deal for a salary.
• Traders: price gaps between states are an opportunity. Food is rising much faster in the South-West than in parts of the North Central.
• Remember the state number can swing. Bauchi jumped 11% in one month. One month is not a trend, so watch two or three releases before making big decisions.
Is your state's number close to what you're feeling at the market? Tell us where you are and what you're seeing.
Quick FAQ
Which state has the highest inflation in Nigeria?
Imo State, at 28.66% year on year in October 2026, followed by Enugu (22.81%) and Kaduna (21.55%).
Which state has the lowest inflation in Nigeria?
Taraba State, at 6.12% in October 2026, then Sokoto (6.68%) and Ekiti (7.64%).
What is Lagos inflation rate in October 2026?
Lagos all-items inflation was 15.54% and food inflation was 31.43% year on year, the second highest food inflation in the country after Ondo (31.74%).
Which state has the lowest food inflation?
Nasarawa, with food inflation of 3.70% in October 2026.
Data source: National Bureau of Statistics, Consumer Price Index October 2026, state profile and Table 5 (Combined Urban and Rural State CPI, Base 2024 = 100). Groupings and comparisons are Naijup analysis.
Found this useful? Share it
Help friends, family and colleagues stay informed on Nigerian finance.
Keep reading
Related Topics
Conversation
Comments (0)
Sign in to join the conversation or like this post.

Mujeeb Olagunju
I am a finance professional with a strong background in economics and financial technology.,My work centers on building systems that support payments, digital banking, and investment solutions in emerging markets.,I have experience with risk management, transaction monitoring, fraud prevention, and the design of scalable financial products tailored to both retail and institutional clients.,With over 8 years of industry experience, I combine financial insight with technical expertise to deliver solutions that balance compliance, security, and business growth.,My goal is to bridge the gap between finance and technology, creating platforms that expand access to modern financial services and strengthen trust in digital finance.
94
Stories
30466
Reads
0
Likes
0
Comments