
10 Months of FAAC Money: All 36 States Ranked by What They Actually Received
Monthly FAAC reports tell you who got what in one month. That is useful, but one month is noisy. A big oil refund or a once-off deduction can move a state up or down the table overnight.
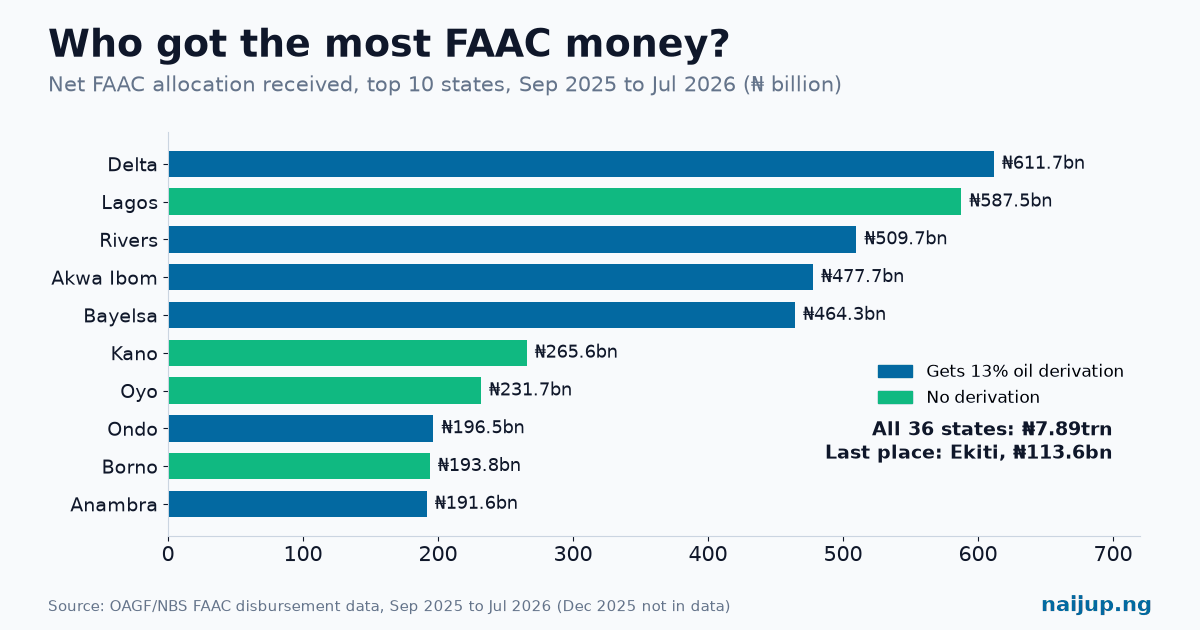
So we added it all up. Using the official FAAC tables for September 2025 to July 2026 (10 sharing months), here is what each state actually received after deductions.
The headline numbers
• Total to 36 states (net): ₦7.89 trillion
• Top state: Delta, ₦611.7 billion
• Bottom state: Ekiti, ₦113.6 billion
• Gap: Delta received 5.4 times what Ekiti received
• Top 5 states' share: 33.6%, about one naira in every three
The full table
| Rank | State | Net received | Avg per month | Gross (before deductions) |
|---|---|---|---|---|
| 1 | Delta | ₦611.7bn | ₦61.2bn | ₦636.2bn |
| 2 | Lagos | ₦587.5bn | ₦58.7bn | ₦760.8bn |
| 3 | Rivers | ₦509.7bn | ₦51.0bn | ₦551.2bn |
| 4 | Akwa Ibom | ₦477.7bn | ₦47.8bn | ₦491.5bn |
| 5 | Bayelsa | ₦464.3bn | ₦46.4bn | ₦476.8bn |
| 6 | Kano | ₦265.6bn | ₦26.6bn | ₦280.6bn |
| 7 | Oyo | ₦231.7bn | ₦23.2bn | ₦258.7bn |
| 8 | Ondo | ₦196.5bn | ₦19.7bn | ₦209.3bn |
| 9 | Borno | ₦193.8bn | ₦19.4bn | ₦203.9bn |
| 10 | Anambra | ₦191.6bn | ₦19.2bn | ₦196.2bn |
| 11 | Jigawa | ₦191.3bn | ₦19.1bn | ₦194.8bn |
| 12 | Imo | ₦191.3bn | ₦19.1bn | ₦214.0bn |
| 13 | Katsina | ₦188.2bn | ₦18.8bn | ₦211.9bn |
| 14 | Benue | ₦182.5bn | ₦18.3bn | ₦189.4bn |
| 15 | Edo | ₦179.0bn | ₦17.9bn | ₦209.4bn |
| 16 | Abia | ₦174.7bn | ₦17.5bn | ₦183.4bn |
| 17 | Niger | ₦173.1bn | ₦17.3bn | ₦194.3bn |
| 18 | Sokoto | ₦170.5bn | ₦17.1bn | ₦185.7bn |
| 19 | Kebbi | ₦169.3bn | ₦16.9bn | ₦176.1bn |
| 20 | Kogi | ₦167.6bn | ₦16.8bn | ₦182.4bn |
| 21 | Adamawa | ₦166.5bn | ₦16.7bn | ₦175.7bn |
| 22 | Kaduna | ₦164.3bn | ₦16.4bn | ₦221.9bn |
| 23 | Zamfara | ₦163.7bn | ₦16.4bn | ₦173.8bn |
| 24 | Enugu | ₦160.2bn | ₦16.0bn | ₦170.9bn |
| 25 | Taraba | ₦156.6bn | ₦15.7bn | ₦162.8bn |
| 26 | Plateau | ₦156.4bn | ₦15.6bn | ₦177.4bn |
| 27 | Yobe | ₦154.9bn | ₦15.5bn | ₦164.1bn |
| 28 | Nasarawa | ₦152.3bn | ₦15.2bn | ₦156.5bn |
| 29 | Bauchi | ₦150.9bn | ₦15.1bn | ₦197.7bn |
| 30 | Kwara | ₦147.2bn | ₦14.7bn | ₦159.8bn |
| 31 | Osun | ₦145.8bn | ₦14.6bn | ₦164.9bn |
| 32 | Ebonyi | ₦142.3bn | ₦14.2bn | ₦155.1bn |
| 33 | Gombe | ₦136.5bn | ₦13.7bn | ₦161.8bn |
| 34 | Ogun | ₦134.2bn | ₦13.4bn | ₦171.5bn |
| 35 | Cross River | ₦127.4bn | ₦12.7bn | ₦167.7bn |
| 36 | Ekiti | ₦113.6bn | ₦11.4bn | ₦157.6bn |
What the table tells us
1. Oil still decides the top of the table
Four of the top five (Delta, Rivers, Akwa Ibom and Bayelsa) are oil states. The reason is the 13% derivation fund. Over 10 months:
• Delta: ₦435.1bn from derivation, about 68% of its gross allocation
• Akwa Ibom: ₦305.8bn
• Bayelsa: ₦303.1bn
• Rivers: ₦227.3bn
Without derivation, Delta's 10 months would look like a middle-table state's.
2. Lagos tops "gross", but Delta tops "net"
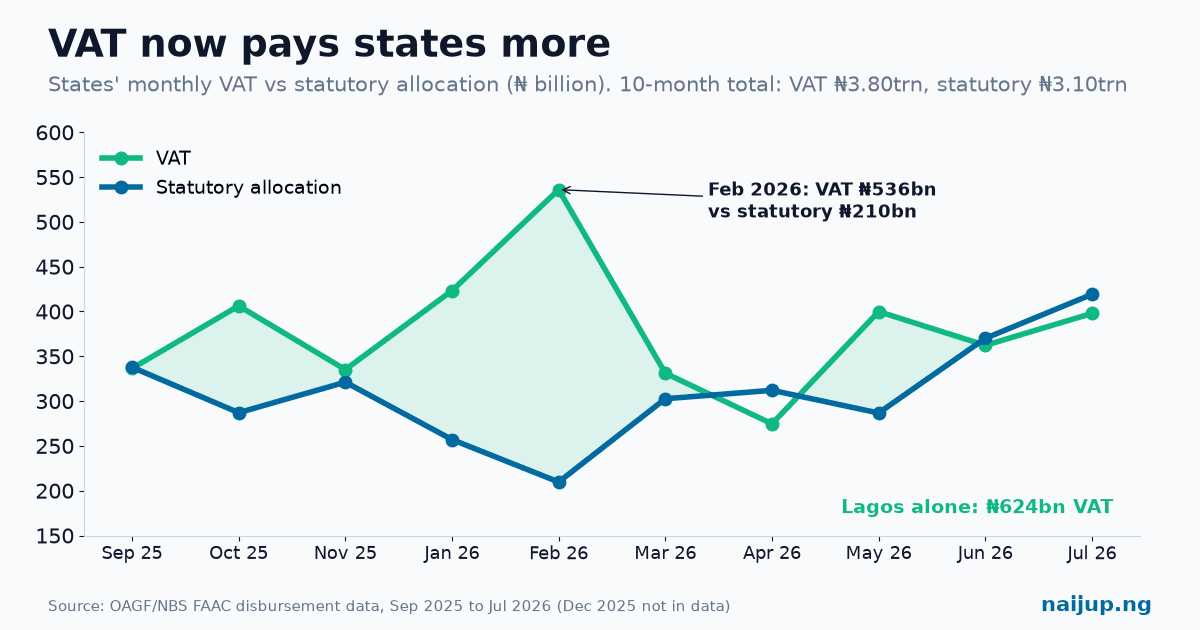
Before deductions, Lagos was number one with ₦760.8 billion, mostly from VAT. But ₦173.3 billion was taken at source for debt and a monthly VAT deduction, which drops Lagos to second place on what actually lands.
3. Kaduna and Bauchi fall the most
Ranked by gross allocation, Kaduna would be 8th and Bauchi 14th. After deductions, they drop to 22nd and 29th. Kaduna lost ₦57.6bn between gross and net (mostly external debt). Bauchi lost ₦46.8bn (debt, ISPO and other deductions).
4. The middle is very crowded
From 8th (Ondo) to 32nd (Ebonyi), most states received between ₦14 billion and ₦20 billion a month. For most of Nigeria, FAAC is a fairly flat formula. Oil, VAT from big cities and debt deductions are what separate the states.
A roller-coaster monthly income
States' combined net allocation went up and down a lot over the 10 months:
| Month shared | All states (net) |
|---|---|
| Sep 2025 | ₦816.5bn |
| Oct 2025 | ₦786.3bn |
| Nov 2025 | ₦752.3bn |
| Jan 2026 | ₦703.3bn |
| Feb 2026 | ₦768.5bn |
| Mar 2026 | ₦661.4bn |
| Apr 2026 | ₦708.2bn |
| May 2026 | ₦836.0bn |
| Jun 2026 | ₦848.4bn |
| Jul 2026 | ₦1,009.7bn |
From the low in March to the high in July, the difference was 53%. Imagine your salary going up by half in four months, without warning. That's how hard it is for a state commissioner of finance to plan.
Final takeaway
If you only read monthly FAAC headlines, you'll miss the pattern. Over 10 months:
• Oil derivation puts the Niger Delta at the top
• VAT keeps Lagos close behind
• Debt deductions pull Kaduna, Bauchi, Ekiti and Lagos down
• And everyone else sits in a tight band of about ₦14bn to ₦20bn a month
Find your state in the table and ask: what did we do with it?
Data source: OAGF FAAC disbursement tables (Table III), September 2025 to July 2026, as reported by the NBS. December 2025 was not in the data set we reviewed. "Net received" is the "Total Net Amount" column, after debt, ISPO, other and VAT deductions and the ecology transfer to NDDC/HYPPADEC. The FCT is not included because it is paid through the federal share. We double-checked the sums, but if you spot a mistake, please let us know.
Keep reading
Related Topics



Conversation
Comments (0)
Sign in to join the conversation or like this post.

Mujeeb Olagunju
I am a finance professional with a strong background in economics and financial technology.,My work centers on building systems that support payments, digital banking, and investment solutions in emerging markets.,I have experience with risk management, transaction monitoring, fraud prevention, and the design of scalable financial products tailored to both retail and institutional clients.,With over 8 years of industry experience, I combine financial insight with technical expertise to deliver solutions that balance compliance, security, and business growth.,My goal is to bridge the gap between finance and technology, creating platforms that expand access to modern financial services and strengthen trust in digital finance.
68
Stories
18561
Reads
0
Likes
0
Comments